© 2020 All rights reserved to Maaal Newspaper
Publisher: Maaal International Media Company
License: 465734
Survey: SR1.5 trillion, retained earnings for 148 companies listed on Saudi Stock Market
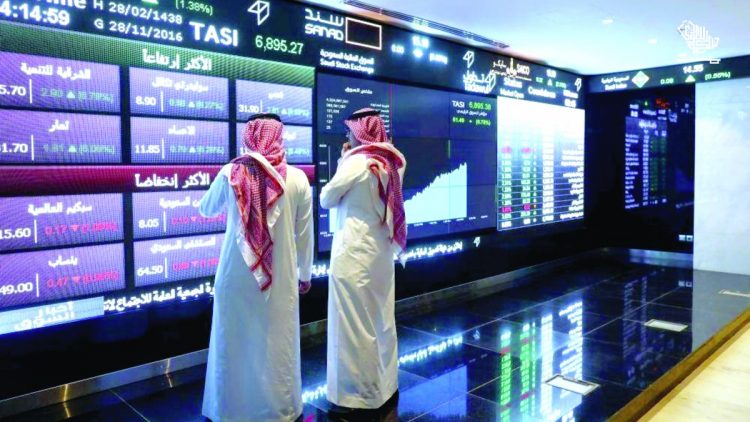
148 companies listed on Tadawul recorded cumulative retained earnings of SR1.48 trillion at the end of the Q2 of 2022, compared to SR1.15 trillion at the end of the corresponding period of last year, increasing their profits by SR325.66 billion, according to a survey conducted by Maaal newspaper.
Aramco, according to the survey, acquired 81% of these profits, with a value of SR1.19 trillion, which is equal to 15.92 times compared to the capital of SR75 billion. Saudi Telecom Company (STC) came in second place, with a value of SR39.86 billion, after it added SR2.57 billion during a year. Then came the Saudi Electricity Company with a value of SR35.83 billion, then each of SABIC, Alahli, Ma’aden and Al-Rajhi with a value of 28.69, 22.24, 15.93, and 10.66 billion riyals, respectively.
Retained earnings are the backbone of the financial structure of companies, as they are usually used in times of crisis, either to cover an emergency loss or to expand the company’s activities, or to pay off unfavourable debts or lawsuits, especially if these debts or lawsuits are the results of things beyond the company’s control, such as fires or the like.
The retained earnings are formed by accumulating the remaining net profit after cash distributions and deducting other funds such as part of the statutory reserve or others. In the event that the company’s management decides not to distribute cash dividends, this part will be transferred to the retained earnings and thus appear within the shareholders’ equity.
In the event that the company’s management decides not to distribute cash dividends, this part will be transferred to the retained earnings and thus appear within the shareholders’ equity. In the event that the company’s management decides not to distribute cash dividends, this part will be transferred to the retained earnings and thus appear within the shareholders’ equity.
According to the survey, 18 companies were able to raise their retained earnings by more than one billion riyals compared to what they were at the end of a year ago, led by Aramco raised its retained profits by SR260.52 billion, followed by SABIC with a value of SR11.83 billion, and Ma’aden with a value of SR7.44 billion, then each of SABIC’s Agri-Nutrients, Saudi National Bank and Kingdom Holding Company, with an amount of SR6.32, 5.89, and SR5.76 billion.
26 companies were able to raise their capital by more than 100%, either by switching from loss to profitability (8 companies) or by doubling profits (18 companies), while 19 companies were able to raise their retained earnings by more than 50% and less than 100%. 14 companies were able to raise their retained earnings by rates ranging between 25% and 50%, while 38 companies were able to raise their retained earnings by less than 25%, and the retained profits of 51 companies declined.
| Retained earnings of listed companies (in million riyals) | ||||
| Second Quarter 2021 | Second Quarter 2022 | Difference | Difference % | |
| Saudi Aramco | 933,545 | 1,194,068 | 260,523 | 28% |
| STC | 37,290 | 39,862 | 2,572 | 7% |
| Saudi Electricity Company | 33,949 | 35,826 | 1,878 | 6% |
| SABIC | 16,860 | 28,694 | 11,834 | 70% |
| Alahli | 16,356 | 22,249 | 5,893 | 36% |
| Ma’aden | 8,483 | 15,927 | 7,444 | 88% |
| Al-Rajhi | 9,193 | 10,658 | 1,464 | 16% |
| Banque Saudi Fransi (BSF) | 8,411 | 9,096 | 686 | 8% |
| Riyad Bank | 4,801 | 9,029 | 4,228 | 88% |
| Dar Al Arkan | 7,135 | 7,518 | 383 | 5% |
| SABIC Agri Nutrients | 946 | 7,271 | 6,325 | 669% |
| Kingdom Holding | 1,469 | 7,226 | 5,757 | 392% |
| YANSAB | 7,298 | 6,697 | -601 | -8% |
| Arab National Bank | 6,120 | 6,689 | 569 | 9% |
| Alinma | 4,536 | 5,329 | 794 | 17% |
| Almarai | 4,494 | 4,986 | 492 | 11% |
| Etihad Etisalat Company ) Mobily) | 4,290 | 4,905 | 616 | 14% |
| SABB | 2,998 | 4,722 | 1,724 | 58% |
| Savola Group | 2,990 | 3,218 | 228 | 8% |
| Sipchem | 1,093 | 3,085 | 1,992 | 182% |
| Bahri | 3,038 | 2,947 | -91 | -3% |
| Alujain | 1,038 | 2,339 | 1,301 | 125% |
| Elm | 1,723 | 2,166 | 443 | 26% |
| ACWA Power | 1,632 | 1,847 | 215 | 13% |
| National Industrialization | 504 | 1,698 | 1,194 | 237% |
| Bupa Arabia for Cooperative Insurance | 1,704 | 1,634 | -70 | -4% |
| Bank Albilad | 2,573 | 1,525 | -1,049 | -41% |
| Petro Rabigh | (1,422) | 1,515 | 2,937 | 207% |
| Saudi Tadawul Group Holding Co. | 186 | 1,451 | 1,265 | 682% |
| Dr. Sulaiman Al Habib Medical Services Group | 1,023 | 1,383 | 359 | 35% |
| Aljazira | 1,161 | 1,323 | 162 | 14% |
| Mouwasat Medical Services (MOUWASAT) | 1,018 | 1,321 | 303 | 30% |
| Saudi Investment Bank | 1,023 | 1,282 | 259 | 25% |
| Seera Group | 1,519 | 1,281 | -239 | -16% |
| Saudi Industrial Investment Group | 1,591 | 1,195 | -396 | -25% |
| Saudi Research and Media Group | 644 | 1,187 | 543 | 84% |
| Southern Province Cement Company | 1,100 | 1,050 | -50 | -5% |
| (SOLUTIONS) | 960 | 1,041 | 81 | 8% |
| Saudi Kayan Petrochemical | (209) | 1,028 | 1,237 | 591% |
| Dallah Healthcare | 840 | 992 | 152 | 18% |
| Yamama Cement | 730 | 882 | 152 | 21% |
| SADAFCO | 856 | 765 | -91 | 11% |
| Arabian Cement | 877 | 707 | -170 | -19% |
| Taiba Investments | 959 | 693 | -266 | -28% |
| Budget Saudi Arabia | 385 | 693 | 308 | 80% |
| Company For Cooperative | 449 | 666 | 217 | 48% |
| Saudi ceramics | 617 | 660 | 42 | 7% |
| Nahdi Medical | 113 | 652 | 540 | 479% |
| Al Rajhi Takaful | 597 | 642 | 45 | 8% |
| Sahel * | 572 | 555 | -17 | -3% |
| Qassim Cement Company | 637 | 524 | -113 | -18% |
| Astra Industrial Group | 225 | 519 | 294 | 131% |
| National Medical Care | 424 | 517 | 93 | 22% |
| Eastern Province Cement | 530 | 499 | -31 | -6% |
| MEPCO | 227 | 495 | 268 | 118% |
| Advanced Petrochemical | 449 | 465 | 16 | 3% |
| Yanbu Cement | 748 | 401 | -347 | -46% |
| Methanol Chemicals Company | (454) | 397 | 852 | 187% |
| United Electronics Company | 261 | 395 | 134 | 51% |
| Al Babtain | 363 | 377 | 14 | 4% |
| GIG | 301 | 347 | 46 | 15% |
| Herfy Food | 209 | 343 | 134 | 64% |
| Othaim Markets | 357 | 294 | -63 | -18% |
| East Pipes Integrated | 270 | 276 | 6 | 2% |
| Northern Region Cement | 274 | 276 | 2 | 1% |
| Almunajem Foods Company | 89 | 270 | 182 | 205% |
| Housing and Development Ban | 276 | 264 | -12 | -4% |
| Basic Chemical Industries | 235 | 256 | 21 | 9% |
| Zain Saudi Arabia | 28 | 253 | 225 | 788% |
| Scientific and Medical Equipment House Co. EQUIPMENT HOUSE * | 239 | 253 | 14 | 6% |
| Shaker Group | (160) | 252 | 412 | 258% |
| National Company for Glass Industries | 185 | 252 | 67 | 36% |
| AL‑DAWAA | 71 | 239 | 168 | 236% |
| GASCO | 124 | 222 | 97 | 78% |
| Al-Arabia | 80 | 220 | 140 | 176% |
| Retal | 104 | 218 | 115 | 110% |
| City Cement | 317 | 213 | -104 | -33% |
| Fitness time | 129 | 209 | 80 | 62% |
| Advanced | 128 | 206 | 78 | 61% |
| Halwani Bros | 226 | 202 | -23 | -10% |
| Al Jouf | 165 | 197 | 32 | 19% |
| Makkah | 146 | 191 | 45 | 31% |
| Bin Dawood | 240 | 190 | -49 | -21% |
| Jarir | 172 | 188 | 17 | 10% |
| Bawan | 115 | 188 | 73 | 63% |
| Umm Al Qura Cement | 176 | 179 | 3 | 2% |
| Amlak | 156 | 179 | 23 | 14% |
| Al Yamamah Steel | 108 | 178 | 70 | 65% |
| SISCO | 238 | 174 | -64 | -27% |
| AMAK | 92 | 168 | 76 | 82% |
| SAUDI GERMAN HEALTH | 499 | 167 | -331 | -66% |
| Tanmeyah | 155 | 162 | 6 | 4% |
| Nama Chemicals | (27) | 161 | 188 | 686% |
| Theeb | 910 | 151 | -759 | -83% |
| Fitaihi Holding | 155 | 150 | -5 | -3% |
| SACO | 224 | 150 | -74 | -33% |
| Saudi Chemical Company | 146 | 147 | 1 | 1% |
| Aldrees | 80 | 146 | 66 | 82% |
| Ataa | 92 | 139 | 47 | 51% |
| Dur | (0.48) | 137 | 137 | 28315% |
| Al Aseel | 190 | 129 | -60 | -32% |
| Nayifat | 98 | 128 | 30 | 30% |
| Arabian Centers | 91 | 127 | 36 | 40% |
| Zmail industrial | 387 | 120 | -267 | -69% |
| Najran Cement | 193 | 114 | -79 | -41% |
| MAHARAH | 121 | 104 | -17 | -14% |
| Alkhorayef | 44 | 102 | 58 | 134% |
| Saudi Marketing | 78 | 98 | 20 | 26% |
| GULF UNION ALAHLIA | 101 | 95 | -6 | -6% |
| Alamar | 39 | 91 | 52 | 135% |
| Electrical Industries | 69 | 81 | 11 | 16% |
| ALHAMMADI | 453 | 78 | -374 | -83% |
| National Company for Learning | 48 | 73 | 25 | 53% |
| Saudi Cement | 329 | 72 | -257 | -78% |
| ARABIAN SHIELD | 60 | 71 | 11 | 19% |
| Ash-Sharqiyah Development | 62 | 63 | 1 | 2% |
| Al Khaleej Training and Education | 26 | 60 | 34 | 131% |
| Baazeem | 57 | 59 | 3 | 5% |
| Saudi Paper Manufacturing Co. | 27 | 59 | 32 | 121% |
| ALLIANZ SF | 51 | 56 | 5 | 10% |
| Hail Cement | 124 | 56 | -67 | -55% |
| Alandalus Property | 260 | 51 | -208 | -80% |
| SASCO | 28 | 48 | 21 | 75% |
| ALOMRAN | 44 | 47 | 3 | 7% |
| Saudi Arabia Refineries | 25 | 45 | 20 | 81% |
| Saudi Vitrified Clay | 53 | 43 | -10 | -19% |
| Saudi Re | 115 | 43 | -73 | -63% |
| ASLAK | 31 | 42 | 11 | 37% |
| Al Waha | 106 | 40 | -66 | -62% |
| Aljazira Takaful | 100 | 37 | -63 | -63% |
| Abu Moati | 28 | 34 | 6 | 22% |
| Buruj Cooperative | 78 | 33 | -45 | -58% |
| Alhokair | (991) | 28 | 1,019 | 103% |
| Lazurde Company for Jewelry | 20 | 27 | 7 | 33% |
| Arab Sea | 30 | 25 | -5 | -16% |
| MIS | 55 | 23 | -32 | -59% |
| CHUBB | 118 | 22 | -97 | -82% |
| NAQI | 25 | 22 | -3 | -13% |
| Saudi Pharmaceutical Industries and Medical Appliances | 127 | 19 | -108 | -85% |
| National Gypsum | 47 | 18 | -29 | -62% |
| Al Abdullatif Industrial | 83 | 18 | -65 | -78%hubb |
| FIPCO | 16 | 15 | -1 | -4% |
| NADEC | 244 | 13 | -231 | -95% |
| SADR | 8 | 4 | -4 | -52% |
| AYYAN | 7 | 3 | -4 | -53% |
| Developments works | 6 | 3 | -3 | -49% |
| ALKATHIRI | 8 | 3 | -5 | -63% |
| Tourism Enterprise | (49) | 0.1 | 49 | 100% |
| Total Market | 1,154,062 | 1,479,720 | 325,657 | 28% |
| * Newly listed and compared companies by the end of 2021 or the first quarter of 2022 | ||||
Related


