Publisher: Maaal International Media Company
License: 465734


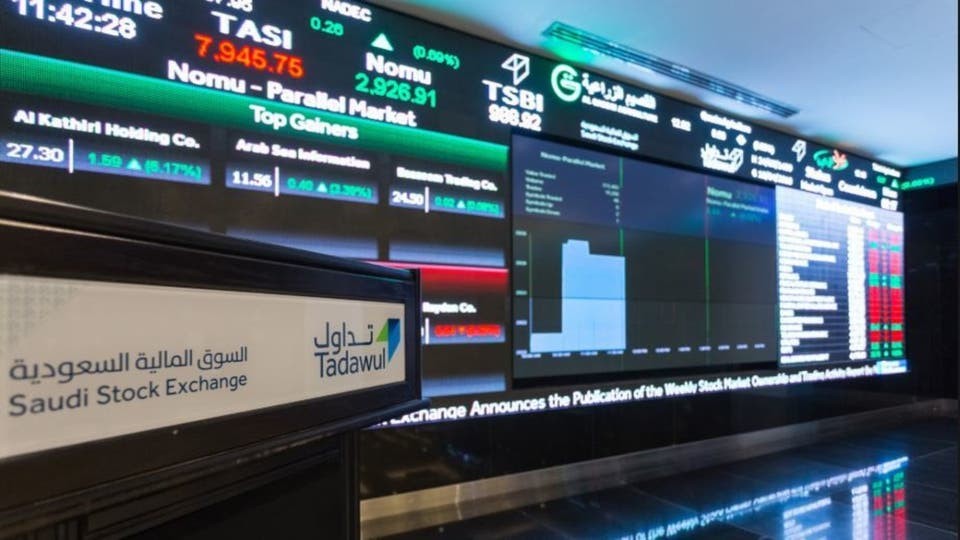
The Saudi stock market index dropped 6.6 points, during the post-session auction on December 19, 2021, ending at 11,160.24 points, down from 11,166.87 points before the auction, with 3.9 million stocks, shared by 7,073 deals, at a closing valuation of SR135.7 million
Shares of 36 companies witnessed an increase, led by CHEP and Emaar 0.9%, Al-Fokhariah 0.7%, Raydan, Herfy and Melkiya REIT 0.6%, while the shares of 97 other companies declined during the auction, led by France 1.2%, Sierra and Astra 1.1%, Saudi Pipes and Bupa 0.9%. And ALJOUF 0.8%.
It’s worth noting that the closing auction is used to determine the market’s closing price. While the equilibrium price is determined during the closing auction, which lasts 10 minutes.
The closing auction begins, at 3:00 pm and concludes, at 3:10 pm, following the end of continuous trading.
On a daily basis, the closing price is derived when orders are processed, at 3:10 pm + a maximum of 30 seconds.
Regular deals are used to compute the closing price, which is the deal price for shares worth more than SR15,000.
In the absence of a regular transaction, the closing price is computed using the price of the previous day’s closing price, in the continuous trading.
Market orders are published in the order book as “Best Bid” during the closing auction, and no price is displayed throughout the auction.
The trading session on the closing price is a following extra time, as the closing price that only to be determined by the closing auction exchanged, and it runs from 3:10 pm to 3:20 pm.
| Change in the stock exchange,
during the auction |
|||
| Statement | Before the auction | Close | Change |
| Market Index | 11,166.87 | 11,160.24 | -6.6 |
| Trading value (Million Riyals) | 5,880.28 | 6,015.9 | 135.7 |
| Traded Amount
(Million Shares) |
172.54 | 176.45 | 3.9 |
| The number of executed transactions | 317,956 | 325,029 | 7073 |
| Advancing companies
during the auction |
|||
| Company | Share price before auction (SR) | Close (SR) | Change (%) |
| CHUBB | 37.9 | 38.25 | 0.92 |
| Emaar EC | 11.8 | 11.9 | 0.85 |
| SVCP | 82.1 | 82.7 | 0.73 |
| RAYDAN | 21.84 | 21.98 | 0.64 |
| Herfy Foods | 65.6 | 66 | 0.61 |
| MULKIA | 9.9 | 9.96 | 0.61 |
| MASHAAR REIT | 8.98 | 9.03 | 0.56 |
| SAUDI GERMAN HEALTH | 32.75 | 32.9 | 0.46 |
| MEPCO | 45.65 | 45.85 | 0.44 |
| SPCC | 69.6 | 69.9 | 0.43 |
| City Cement | 22.8 | 22.88 | 0.35 |
| Atheeb Telecom | 30.7 | 30.8 | 0.33 |
| ALABDULLATIF | 30.8 | 30.9 | 0.32 |
| NADEC | 31.65 | 31.75 | 0.32 |
| Alinma Tokio M | 32.7 | 32.8 | 0.31 |
| Amlak | 21.42 | 21.48 | 0.28 |
| MOUWASAT | 166.8 | 167.2 | 0.24 |
| Sipchem | 44.8 | 44.9 | 0.22 |
| ALHOKAIR GROUP | 18.86 | 18.9 | 0.21 |
| WALAA | 19.26 | 19.3 | 0.21 |
| STC | 110 | 110.2 | 0.18 |
| FITNESS TIME | 112 | 112.2 | 0.18 |
| Maadaniyah | 29.1 | 29.15 | 0.17 |
| BURUJ | 23.96 | 24 | 0.17 |
| TADAWUL GROUP | 125.2 | 125.4 | 0.16 |
| YANSAB | 67.1 | 67.2 | 0.15 |
| ALRAJHI | 139.6 | 139.8 | 0.14 |
| ZOUJAJ | 39.8 | 39.85 | 0.13 |
| JADWA | 8.37 | 8.38 | 0.12 |
| Fitaihi Group | 42.8 | 42.85 | 0.12 |
| SABIC AGRI-NUTRIENTS | 171.8 | 172 | 0.12 |
| SAPTCO | 22.1 | 22.12 | 0.09 |
| LAZURDE | 22.1 | 22.12 | 0.09 |
| Red sea | 22.22 | 22.24 | 0.09 |
| ALJAZIRA RIET | 23.08 | 23.1 | 0.09 |
| SHAKER | 23.94 | 23.96 | 0.08 |
| Declining companies
during the auction |
|||
| Company | Share price before auction (SR) | Close (SR) | Change (%) |
| BSFR | 42.6 | 42.1 | -1.17 |
| SEERA | 18.3 | 18.1 | -1.09 |
| ASTRA INDUSTRIAL | 38 | 37.6 | -1.05 |
| SSP | 26.55 | 26.3 | -0.94 |
| Bupa Arabia | 136.4 | 135.2 | -0.88 |
| ALJOUF | 61.2 | 60.7 | -0.82 |
| ALZAMIL INDUST | 30.1 | 29.9 | -0.66 |
| MAADEN | 76.3 | 75.8 | -0.66 |
| Jadwa | 15.7 | 15.6 | -0.64 |
| SPIMACO | 39.5 | 39.25 | -0.63 |
| Saudi Ceramics | 53.4 | 53.1 | -0.56 |
| BATIC | 26.9 | 26.75 | -0.56 |
| Al-Omran | 110 | 109.4 | -0.55 |
| ATC | 36.7 | 36.5 | -0.54 |
| Tawuniya | 77 | 76.6 | -0.52 |
| SISCO | 30.9 | 30.75 | -0.49 |
| TADCO | 32.05 | 31.9 | -0.47 |
| ALHOKAIR | 17.42 | 17.34 | -0.46 |
| ALBABTAIN | 32.85 | 32.7 | -0.46 |
| ALALAMIYA | 24.4 | 24.3 | -0.41 |
| QACCO | 75.9 | 75.6 | -0.40 |
| AWPT | 106.8 | 106.4 | -0.37 |
| RIYAD | 27.1 | 27 | -0.37 |
| EIC | 27.55 | 27.45 | -0.36 |
| Alinma | 23.72 | 23.64 | -0.34 |
| SASCO | 29.9 | 29.8 | -0.33 |
| ZAIN KSA | 12.2 | 12.16 | -0.33 |
| SEDCO CAPITAL | 12.22 | 12.18 | -0.33 |
| UACC | 24.5 | 24.42 | -0.33 |
| THEEB | 62.5 | 62.3 | -0.32 |
| Arab Sea | 189.6 | 189 | -0.32 |
| Budget Saudi | 47.55 | 47.4 | -0.32 |
| Care | 63.8 | 63.6 | -0.31 |
| SIIG | 32.2 | 32.1 | -0.31 |
| ALETIHAD | 20.26 | 20.2 | -0.30 |
| MESC | 20.68 | 20.62 | -0.29 |
| Nama Chemicals | 34.7 | 34.6 | -0.29 |
| Batic Rights | 14.5 | 14.46 | -0.28 |
| AYYAN | 21.86 | 21.8 | -0.27 |
| Dallah Health | 73.4 | 73.2 | -0.27 |
| ALBAHA | 36.75 | 36.65 | -0.27 |
| Wafrah | 149.8 | 149.4 | -0.27 |
| ACIG | 37.6 | 37.5 | -0.27 |
| MEFIC REIT | 7.64 | 7.62 | -0.26 |
| TICO | 172.8 | 172.4 | -0.23 |
| MEDGULF | 17.3 | 17.26 | -0.23 |
| OASIS | 86.9 | 86.7 | -0.23 |
| ALBILAD | 45.1 | 45 | -0.22 |
| Amiantit | 19.04 | 19 | -0.21 |
| MUSHARAKA REIT | 10.02 | 10 | -0.20 |
| ALASEEL | 50.5 | 50.4 | -0.20 |
| Arabian Shield | 26.65 | 26.6 | -0.19 |
| YSCC | 27.7 | 27.65 | -0.18 |
| Jabal Omar | 27.8 | 27.75 | -0.18 |
| Saudi Cement | 56.1 | 56 | -0.18 |
| Al Rajhi REIT | 11.34 | 11.32 | -0.18 |
| SABIC | 114 | 113.8 | -0.18 |
| Bazeem | 115.8 | 115.6 | -0.17 |
| SABB Takaful | 30.45 | 30.4 | -0.16 |
| Etihad Etisalat | 30.75 | 30.7 | -0.16 |
| ASLAK | 32.1 | 32.05 | -0.16 |
| Nayifat | 32.4 | 32.35 | -0.15 |
| Savola Group | 32.9 | 32.85 | -0.15 |
| Extra | 133.2 | 133 | -0.15 |
| UCA | 33.9 | 33.85 | -0.15 |
| Advanced | 67.9 | 67.8 | -0.15 |
| MIS | 139.4 | 139.2 | -0.14 |
| CHEMICAL | 35.05 | 35 | -0.14 |
| SARCO | 140.8 | 140.6 | -0.14 |
| Chemanol | 35.65 | 35.6 | -0.14 |
| Bawan | 37 | 36.95 | -0.14 |
| Amana Insurance | 37.05 | 37 | -0.13 |
| YCC | 37.25 | 37.2 | -0.13 |
| ALKATHIRI | 75.1 | 75 | -0.13 |
| ACC | 38.25 | 38.2 | -0.13 |
| Maharah | 76.6 | 76.5 | -0.13 |
| Catering | 79.9 | 79.8 | -0.13 |
| ACWA Power | 80 | 79.9 | -0.12 |
| Petrochem | 40.15 | 40.1 | -0.12 |
| ALRAJHI TAKAFUL | 81.3 | 81.2 | -0.12 |
| SULAIMAN ALHABIB | 163.2 | 163 | -0.12 |
| ALSAGR INSURANCE | 16.4 | 16.38 | -0.12 |
| ABO MOATI | 41.25 | 41.2 | -0.12 |
| SRMG | 166.8 | 166.6 | -0.12 |
| Saudi Re | 16.94 | 16.92 | -0.12 |
| SAIB | 17.54 | 17.52 | -0.11 |
| Saudi Kayan | 17.6 | 17.58 | -0.11 |
| ALARABIA | 88.3 | 88.2 | -0.11 |
| EPCCO | 44.75 | 44.7 | -0.11 |
| APC | 17.96 | 17.94 | -0.11 |
| SOLUTIONS | 182.6 | 182.4 | -0.11 |
| ASEER | 20.32 | 20.3 | -0.10 |
| ALMRAKEZ | 21.92 | 21.9 | -0.09 |
| SAUDI CABLE | 22.02 | 22 | -0.09 |
| SAICO | 22.02 | 22 | -0.09 |
| SPPC | 22.82 | 22.8 | -0.09 |
| GACO | 24.9 | 24.88 | -0.08 |
Source: Tadawul, Maaal follo


Publisher: Maaal International Media Company
License: 465734
© 2025 All rights reserved to Maaal Newspaper