
Publisher: Maaal International Media Company
License: 465734


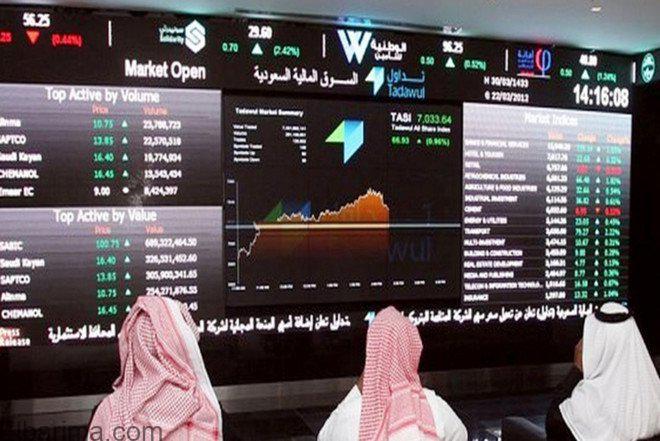
Change in the stock market during the auction period |
|||
Statement |
Before the auction |
Close |
Change |
Market Index |
11453.11 |
11495.76 |
42.6 |
Trading value (SRmln) |
6048.15 |
6679.3 |
631.1 |
Traded Amount (mln Shares) |
169.87 |
181.90 |
12.0 |
The number of executed transactions |
284140 |
293043 |
8903 |
Advancing shares during the auction period |
|||
Company |
Before the auction |
Close (SR) |
Change (%) |
BUPA ARABIA |
146 |
149.2 |
2.19 |
BSFR |
40.95 |
41.7 |
1.83 |
Saudi Cement |
61.9 |
62.8 |
1.45 |
SAAB |
32.75 |
33.15 |
1.22 |
MAADEN |
82.9 |
83.8 |
1.09 |
SABIC AGRI-NUTRIENTS |
171.2 |
173 |
1.05 |
Almarai |
57.4 |
58 |
1.05 |
ZAMIL INDUST |
39.05 |
39.45 |
1.02 |
Petro Rabigh |
27.75 |
28 |
0.90 |
ALHAMMADI |
38.15 |
38.45 |
0.79 |
JARIR |
208 |
209.6 |
0.77 |
City Cement |
26.4 |
26.6 |
0.76 |
QACCO |
82.4 |
83 |
0.73 |
MOUWASAT |
179.8 |
181 |
0.67 |
SNB |
61 |
61.4 |
0.66 |
MESC |
22.04 |
22.18 |
0.64 |
STC |
126.2 |
127 |
0.63 |
Budger Saudi |
49.35 |
49.65 |
0.61 |
SULAIMAN ALHABIB |
173 |
174 |
0.58 |
FARM SUPERSTORES |
35.55 |
35.75 |
0.56 |
Catering |
89 |
89.5 |
0.56 |
SASCO |
36.35 |
36.55 |
0.55 |
SIECO |
118 |
118.6 |
0.51 |
SIIG |
40.6 |
40.8 |
0.49 |
Jabal Omar |
30.55 |
30.7 |
0.49 |
Bawan |
43.15 |
43.35 |
0.46 |
Extra |
142 |
142.6 |
0.42 |
Wataniya |
48.7 |
48.9 |
0.41 |
DAR ALARKAN |
10.26 |
10.3 |
0.39 |
ALBAHA |
39.8 |
39.95 |
0.38 |
ALJAZIRA REIT |
26.7 |
26.8 |
0.37 |
RIBL |
26.9 |
27 |
0.37 |
ALKATHIRI |
81 |
81.3 |
0.37 |
Arab Sea |
162.2 |
162.8 |
0.37 |
SADAFCO |
164.4 |
165 |
0.36 |
ANB |
22.88 |
22.96 |
0.35 |
Saudi Pipes |
29.5 |
29.6 |
0.34 |
Nama Chemicals |
46.35 |
46.5 |
0.32 |
Etihad Etisalat |
31.1 |
31.2 |
0.32 |
SABIC |
127 |
127.4 |
0.31 |
TALEEM REIT |
14.66 |
14.7 |
0.27 |
Arabian Shield |
23.8 |
23.86 |
0.25 |
AlBilad |
40.8 |
40.9 |
0.25 |
ALMRAKEZ |
24.72 |
24.78 |
0.24 |
MIC |
167 |
167.4 |
0.24 |
Sipchem |
43.7 |
43.8 |
0.23 |
BATIC |
44.1 |
44.2 |
0.23 |
ALRAJHI TAKAFUL |
93.7 |
93.9 |
0.21 |
SVCP |
96.1 |
96.3 |
0.21 |
ALKHABEER REIT |
9.66 |
9.68 |
0.21 |
Allianz SF |
25 |
25.05 |
0.20 |
TCC |
20.28 |
20.32 |
0.20 |
MASHAAR REIT |
10.16 |
10.18 |
0.20 |
Bonyan REIT |
10.16 |
10.18 |
0.20 |
MULKIA REIT |
10.22 |
10.24 |
0.20 |
SAPTCO |
26.55 |
26.6 |
0.19 |
TANMIAH |
107 |
107.2 |
0.19 |
SHARQIYAH DEV |
107.2 |
107.4 |
0.19 |
Fitaihi Group |
53.7 |
53.8 |
0.19 |
BINDAWOOD |
107.4 |
107.6 |
0.19 |
SEERA |
21.82 |
21.86 |
0.18 |
RED SEA |
27.3 |
27.35 |
0.18 |
ARDCO |
27.45 |
27.5 |
0.18 |
A.OTHAIM |
112.4 |
112.6 |
0.18 |
ALKHALEEJ TRNG |
28.45 |
28.5 |
0.18 |
ALALAMIYA |
28.45 |
28.5 |
0.18 |
YSCC |
30.15 |
30.2 |
0.17 |
ALRAJHI |
122.4 |
122.6 |
0.16 |
ACIG |
127.8 |
128 |
0.16 |
Theeb |
65.7 |
65.8 |
0.15 |
Emaar |
13.28 |
13.3 |
0.15 |
ALUJAIN |
67.5 |
67.6 |
0.15 |
ZAIN KSA |
13.98 |
14 |
0.14 |
Saudi Aramco |
35.95 |
36 |
0.14 |
NADEC |
36.45 |
36.5 |
0.14 |
TECO |
74.7 |
74.8 |
0.13 |
Advanced |
74.9 |
75 |
0.13 |
SWICORP WABEL |
8.01 |
8.02 |
0.12 |
AL Maather REIT |
9.17 |
9.18 |
0.11 |
BJAZ |
18.4 |
18.42 |
0.11 |
Saudi Re |
18.58 |
18.6 |
0.11 |
EPCCO |
49.9 |
49.95 |
0.10 |
Saudi Kayan |
20.5 |
20.52 |
0.10 |
SAICO |
22.24 |
22.26 |
0.09 |
Declining shares during the auction period |
|||
Company |
Before the auction |
Close (SR) |
Change (%) |
MEDGULF |
23.88 |
23.74 |
-0.59 |
FITNESS TIME |
105.2 |
104.6 |
-0.57 |
ALDREES |
73.3 |
72.9 |
-0.55 |
SPIMACO |
46.75 |
46.55 |
-0.43 |
Chemanol |
36 |
35.85 |
-0.42 |
Amana Insurance |
50.7 |
50.5 |
-0.39 |
SARCO |
162.4 |
161.8 |
-0.37 |
ACIG |
43.25 |
43.1 |
-0.35 |
SAAB Takaful |
31 |
30.9 |
-0.32 |
Alahli REIT |
13.96 |
13.92 |
-0.29 |
Dallah Health |
71 |
70.8 |
-0.28 |
Savola Group |
37.6 |
37.5 |
-0.27 |
JADWA REIT |
8.91 |
8.89 |
-0.22 |
ANAAM HOLDING |
102.2 |
102 |
-0.20 |
SPPC |
26.8 |
26.75 |
-0.19 |
UACC |
28.35 |
28.3 |
-0.18 |
Malath Insurance |
30.35 |
30.3 |
-0.16 |
Al Rajhi REIT |
12.58 |
12.56 |
-0.16 |
Baazeem |
126.2 |
126 |
-0.16 |
CHUBB |
32.3 |
32.25 |
-0.15 |
SEDCO CAPITAL |
13.12 |
13.1 |
-0.15 |
ALABDULLATIF |
34.9 |
34.85 |
-0.14 |
Jadwa REIT Saudi |
14.2 |
14.18 |
-0.14 |
ALBABTAIN |
38.9 |
38.85 |
-0.13 |
Gulf General |
16.04 |
16.02 |
-0.12 |
TADCO |
40.15 |
40.1 |
-0.12 |
SRMG |
162.2 |
162 |
-0.12 |
Maharah |
81.7 |
81.6 |
-0.12 |
ATC |
40.9 |
40.85 |
-0.12 |
YCC |
41.2 |
41.15 |
-0.12 |
ALYAMAMAH |
47.55 |
47.5 |
-0.11 |
BCI |
47.8 |
47.75 |
-0.10 |
ABO MOATI |
49.95 |
49.9 |
-0.10 |
Walaa |
21.5 |
21.48 |
-0.09 |
SIDC |
21.9 |
21.88 |
-0.09 |
ALHOKAIR GROUP |
23.14 |
23.12 |
-0.09 |
SRECO |
23.52 |
23.5 |
-0.09 |
Salama |
24 |
23.98 |
-0.08 |
Change in the stock market during the auction period |
|||
Statement |
Before the auction |
Close |
Change |
Market Index |
11453.11 |
11495.76 |
42.6 |
Trading value (SRmln) |
6048.15 |
6679.3 |
631.1 |
Traded Amount (mln Shares) |
169.87 |
181.90 |
12.0 |
The number of executed transactions |
284140 |
293043 |
8903 |
Advancing shares during the auction period |
|||
Company |
Before the auction |
Close (SR) |
Change (%) |
BUPA ARABIA |
146 |
149.2 |
2.19 |
BSFR |
40.95 |
41.7 |
1.83 |
Saudi Cement |
61.9 |
62.8 |
1.45 |
SAAB |
32.75 |
33.15 |
1.22 |
MAADEN |
82.9 |
83.8 |
1.09 |
SABIC AGRI-NUTRIENTS |
171.2 |
173 |
1.05 |
Almarai |
57.4 |
58 |
1.05 |
ZAMIL INDUST |
39.05 |
39.45 |
1.02 |
Petro Rabigh |
27.75 |
28 |
0.90 |
ALHAMMADI |
38.15 |
38.45 |
0.79 |
JARIR |
208 |
209.6 |
0.77 |
City Cement |
26.4 |
26.6 |
0.76 |
QACCO |
82.4 |
83 |
0.73 |
MOUWASAT |
179.8 |
181 |
0.67 |
SNB |
61 |
61.4 |
0.66 |
MESC |
22.04 |
22.18 |
0.64 |
STC |
126.2 |
127 |
0.63 |
Budger Saudi |
49.35 |
49.65 |
0.61 |
SULAIMAN ALHABIB |
173 |
174 |
0.58 |
FARM SUPERSTORES |
35.55 |
35.75 |
0.56 |
Catering |
89 |
89.5 |
0.56 |
SASCO |
36.35 |
36.55 |
0.55 |
SIECO |
118 |
118.6 |
0.51 |
SIIG |
40.6 |
40.8 |
0.49 |
Jabal Omar |
30.55 |
30.7 |
0.49 |
Bawan |
43.15 |
43.35 |
0.46 |
Extra |
142 |
142.6 |
0.42 |
Wataniya |
48.7 |
48.9 |
0.41 |
DAR ALARKAN |
10.26 |
10.3 |
0.39 |
ALBAHA |
39.8 |
39.95 |
0.38 |
ALJAZIRA REIT |
26.7 |
26.8 |
0.37 |
RIBL |
26.9 |
27 |
0.37 |
ALKATHIRI |
81 |
81.3 |
0.37 |
Arab Sea |
162.2 |
162.8 |
0.37 |
SADAFCO |
164.4 |
165 |
0.36 |
ANB |
22.88 |
22.96 |
0.35 |
Saudi Pipes |
29.5 |
29.6 |
0.34 |
Nama Chemicals |
46.35 |
46.5 |
0.32 |
Etihad Etisalat |
31.1 |
31.2 |
0.32 |
SABIC |
127 |
127.4 |
0.31 |
TALEEM REIT |
14.66 |
14.7 |
0.27 |
Arabian Shield |
23.8 |
23.86 |
0.25 |
AlBilad |
40.8 |
40.9 |
0.25 |
ALMRAKEZ |
24.72 |
24.78 |
0.24 |
MIC |
167 |
167.4 |
0.24 |
Sipchem |
43.7 |
43.8 |
0.23 |
BATIC |
44.1 |
44.2 |
0.23 |
ALRAJHI TAKAFUL |
93.7 |
93.9 |
0.21 |
SVCP |
96.1 |
96.3 |
0.21 |
ALKHABEER REIT |
9.66 |
9.68 |
0.21 |
Allianz SF |
25 |
25.05 |
0.20 |
TCC |
20.28 |
20.32 |
0.20 |
MASHAAR REIT |
10.16 |
10.18 |
0.20 |
Bonyan REIT |
10.16 |
10.18 |
0.20 |
MULKIA REIT |
10.22 |
10.24 |
0.20 |
SAPTCO |
26.55 |
26.6 |
0.19 |
TANMIAH |
107 |
107.2 |
0.19 |
SHARQIYAH DEV |
107.2 |
107.4 |
0.19 |
Fitaihi Group |
53.7 |
53.8 |
0.19 |
BINDAWOOD |
107.4 |
107.6 |
0.19 |
SEERA |
21.82 |
21.86 |
0.18 |
RED SEA |
27.3 |
27.35 |
0.18 |
ARDCO |
27.45 |
27.5 |
0.18 |
A.OTHAIM |
112.4 |
112.6 |
0.18 |
ALKHALEEJ TRNG |
28.45 |
28.5 |
0.18 |
ALALAMIYA |
28.45 |
28.5 |
0.18 |
YSCC |
30.15 |
30.2 |
0.17 |
ALRAJHI |
122.4 |
122.6 |
0.16 |
ACIG |
127.8 |
128 |
0.16 |
Theeb |
65.7 |
65.8 |
0.15 |
Emaar |
13.28 |
13.3 |
0.15 |
ALUJAIN |
67.5 |
67.6 |
0.15 |
ZAIN KSA |
13.98 |
14 |
0.14 |
Saudi Aramco |
35.95 |
36 |
0.14 |
NADEC |
36.45 |
36.5 |
0.14 |
TECO |
74.7 |
74.8 |
0.13 |
Advanced |
74.9 |
75 |
0.13 |
SWICORP WABEL |
8.01 |
8.02 |
0.12 |
AL Maather REIT |
9.17 |
9.18 |
0.11 |
BJAZ |
18.4 |
18.42 |
0.11 |
Saudi Re |
18.58 |
18.6 |
0.11 |
EPCCO |
49.9 |
49.95 |
0.10 |
Saudi Kayan |
20.5 |
20.52 |
0.10 |
SAICO |
22.24 |
22.26 |
0.09 |
Declined shares during the auction period |
|||
Company |
Before the auction |
Close (SR) |
Change (%) |
MEDGULF |
23.88 |
23.74 |
-0.59 |
FITNESS TIME |
105.2 |
104.6 |
-0.57 |
ALDREES |
73.3 |
72.9 |
-0.55 |
SPIMACO |
46.75 |
46.55 |
-0.43 |
Chemanol |
36 |
35.85 |
-0.42 |
Amana Insurance |
50.7 |
50.5 |
-0.39 |
SARCO |
162.4 |
161.8 |
-0.37 |
ACIG |
43.25 |
43.1 |
-0.35 |
SAAB Takaful |
31 |
30.9 |
-0.32 |
Alahli REIT |
13.96 |
13.92 |
-0.29 |
Dallah Health |
71 |
70.8 |
-0.28 |
Savola Group |
37.6 |
37.5 |
-0.27 |
JADWA REIT |
8.91 |
8.89 |
-0.22 |
ANAAM HOLDING |
102.2 |
102 |
-0.20 |
SPPC |
26.8 |
26.75 |
-0.19 |
UACC |
28.35 |
28.3 |
-0.18 |
Malath Insurance |
30.35 |
30.3 |
-0.16 |
Al Rajhi REIT |
12.58 |
12.56 |
-0.16 |
Baazeem |
126.2 |
126 |
-0.16 |
CHUBB |
32.3 |
32.25 |
-0.15 |
SEDCO CAPITAL |
13.12 |
13.1 |
-0.15 |
ALABDULLATIF |
34.9 |
34.85 |
-0.14 |
Jadwa REIT Saudi |
14.2 |
14.18 |
-0.14 |
ALBABTAIN |
38.9 |
38.85 |
-0.13 |
Gulf General |
16.04 |
16.02 |
-0.12 |
TADCO |
40.15 |
40.1 |
-0.12 |
SRMG |
162.2 |
162 |
-0.12 |
Maharah |
81.7 |
81.6 |
-0.12 |
ATC |
40.9 |
40.85 |
-0.12 |
YCC |
41.2 |
41.15 |
-0.12 |
ALYAMAMAH |
47.55 |
47.5 |
-0.11 |
BCI |
47.8 |
47.75 |
-0.10 |
ABO MOATI |
49.95 |
49.9 |
-0.10 |
Walaa |
21.5 |
21.48 |
-0.09 |
SIDC |
21.9 |
21.88 |
-0.09 |
ALHOKAIR GROUP |
23.14 |
23.12 |
-0.09 |
SRECO |
23.52 |
23.5 |
-0.09 |
Salama |
24 |
23.98 |
-0.08 |


Publisher: Maaal International Media Company
License: 465734
© 2025 All rights reserved to Maaal Newspaper