Publisher: Maaal International Media Company
License: 465734

Tuesday, 24 June 2025

How Inflation Impacts the Saudi’s Economy, Interest Rates?

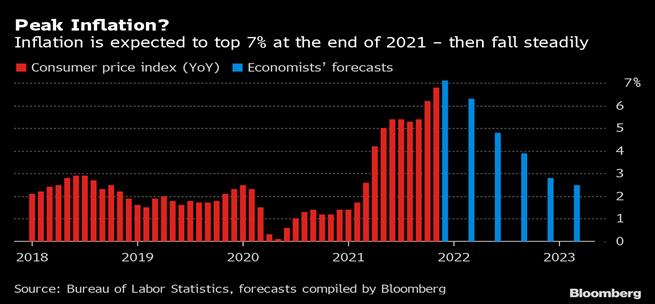
We were only a few days into 2022 before unprecedented economic developments struck. U.S. inflation shot up to 7%, the highest since 1982. These numbers, which have not receded since the middle of last year, have the Federal Reserve worried. Voicing that concern, it revised its interest rate hike expectations to three times in 2022, and three more in 2023. This accompanied lessening the intensity of quantitative easing and limiting market liquidity.
Is inflation “transitory” or “permanent”? That is what everyone was asking last year when U.S. inflation began exceeding the 2% target. The Fed argued for “transitory”, seeing the
inflation as a temporary symptom of the pandemic.
But only months later, doubts emerged. Facing criticism from the economic and financial community, Fed Chair Jerome Powell clarified that what he meant was the effect of this inflation would be “transitory”, not “permanent”. That is, inflation will not scar the economy in the long run.
Meanwhile, supply chain disruptions contributed to rises in many commodity prices. Due to logistical challenges, energy and food prices surged in the U.S. and worldwide. Alongside other pandemic hardships, this contributed to the Fed and other global central banks launching stimulus packages to help economies recover.
We all know financing the deficit by pumping liquidity and increasing the money supply leads to inflation. But where is the bullet-proof equation that answers the timing and strength of the expected inflation? Does it subside in a year after quantitative easing? Two years? Here come monetary and fiscal policies (quantitative and qualitative) to tame this monster.
The economy is too complex to control with numbers and indicators alone. Economic data and how they interact differ over time, and each era is peculiar – no matter how advanced the mathematical and statistical models may be. For example, the target inflation number in the U.S. (2%) may be unideal based on the economy’s structure and the state of the data right now.
Since January 2012, the Fed has been releasing the most popular and scrutinized chart on the market every quarter. This so-called “Dot Plot” chart identifies the Fed’s expectations of the key short-term interest rate that it controls. It reveals these expectations for the next three years and the long term. The dots show each Fed member’s anonymous vote on the expected rate movement.
But is this chart accurate, and will it come true? Of course not. Absolutely not. But it hints at what is happening in the Fed’s corridors and its expectations (which are battered by waves of crises and changes right, left, and centre). Two Dot Plot charts show us the massive shift in Fed expectations.
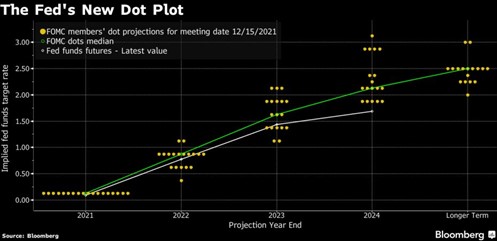
In March 2021, the Fed expected no interest rates in 2022 and 2023. But only a month ago, as we mentioned, expectations changed surprisingly, indicating at least six in 2022 and 2023. The core reason is inflation concerns, which exceeded their expectations. And this was before the announcement of 7% inflation. Here is the Dot Plot chart from March 2021:
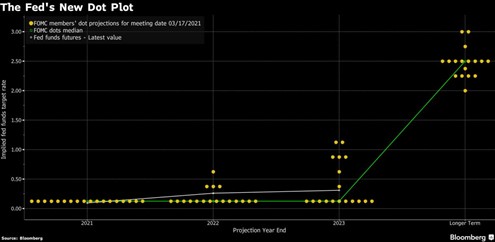
The green path indicates the median of expectations of interest rate changes. Between the March 2021 chart above and the December 2021 below, we see the huge jump in the Fed’s expectations.
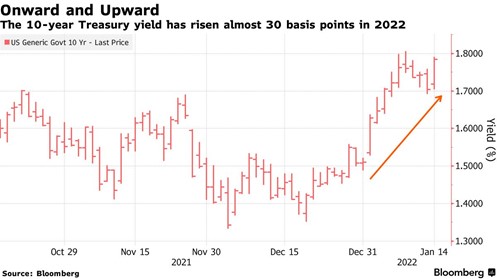
Consequently, U.S. Treasury yields are flying back up to pre-pandemic levels. Below is a graph of U.S. bond yields for 10 years. What does it mean? Many investors who bought fixed-return bonds/sukuk right after the pandemic interest rate crash will record losses in their investment market value. This applies when only considering the market aspect movement, excluding others such as credit risk.
Is this the end of inflation? And will it be gentler with the complete return of business and the end of the pandemic shock cycle, or will it worsen and intensify? What if the Fed started raising rates, and the global economy faced another roadblock and had to cut rates again or stay near zero? Many questions and possibilities exist in all directions.
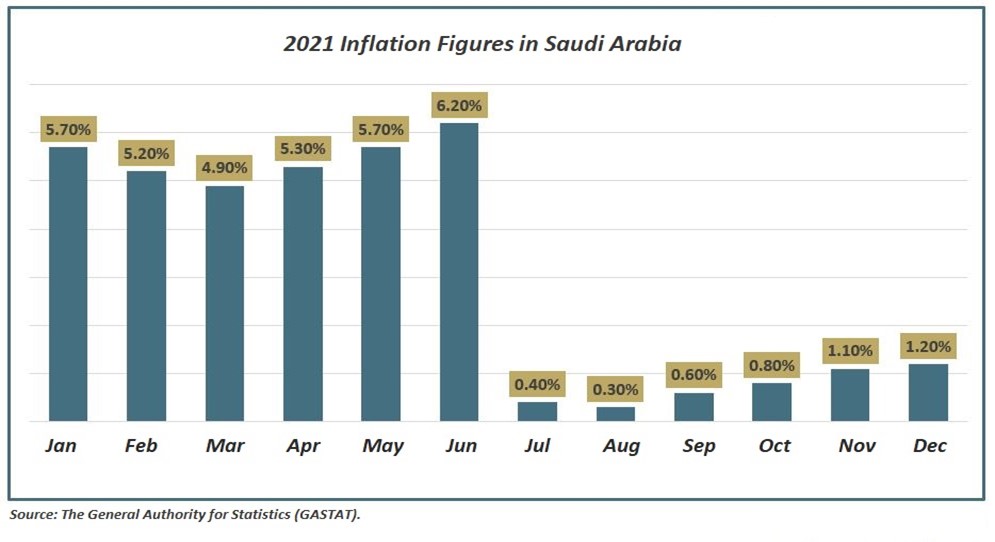
What about the Saudi economy? Our inflation is lower than the U.S.’s. Average inflation was around 5.5% in the first half of 2021, but this is largely due to the temporary consequences of raising the tax from 5% to 15%. As for the second half of 2021, we recorded average inflation of only 0.73%.
But by virtue of our peg to the dollar, the central bank must keep pace with the Fed’s movement of interest rates to maintain monetary stability and the 3.75 exchange rate. However, local economic conditions also affect the interest rate (e.g., market liquidity and oil prices). We all witnessed 2016 when the U.S. interest rates (LIBOR) were below 1%. However, due to the local liquidity pressure and the decline in oil prices, the SAIBOR (the Saudi Interbank Offered Rate) flew to levels far from the reasonable margin between the two rate indices, although it then returned to the natural levels.
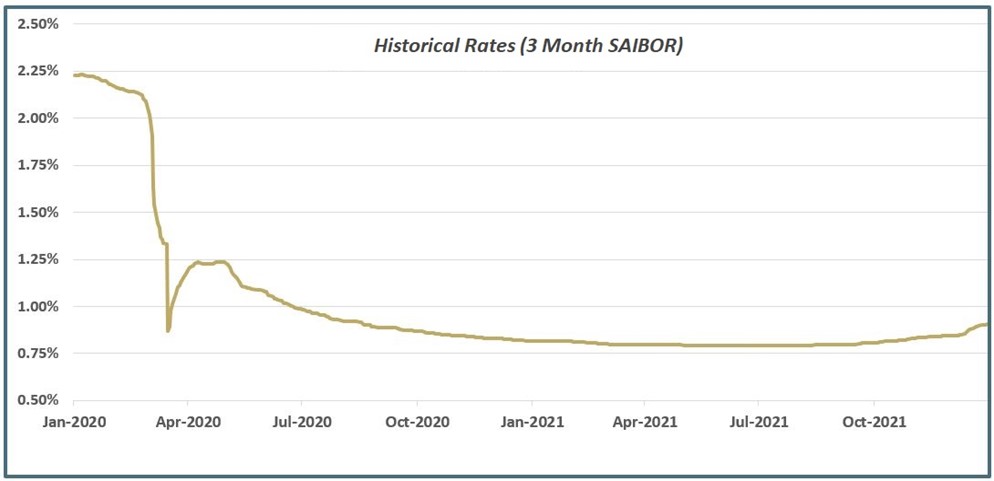
Due to the hikes in the U.S. future interest rate expectations and LIBOR, the SAIBOR rate is rising after a long period of stagnation beginning in 2020 (as the chart below shows).
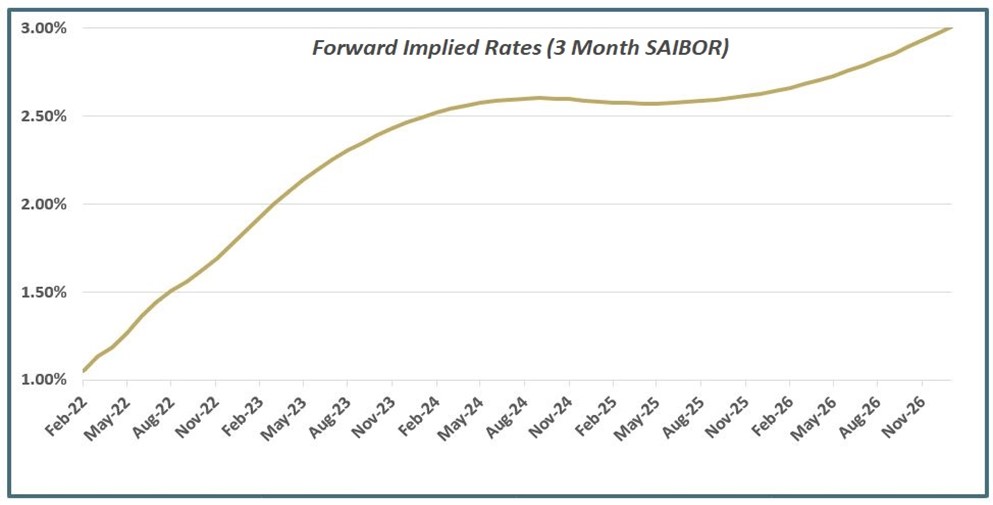
Now compare that to the SAIBOR expectations for the upcoming period! The graph below shows this as of 12-30-2021, according to the market-implied curve. You can imagine the SAIBOR, which is below 1%, and how it will impact balance sheets if it exceeds 2% within a year or less.
All this will undoubtedly raise the cost of lending to companies and individuals and reduce the abundance of cash. As for the impact on the equity market, the discussion is prolonged and complex. But the general rule says higher interest rates will raise the cost of debt to companies, impact valuation, and make their shares look less attractive. Likewise, the individual will suffer from higher consumption costs.
But we must examine the current state of the economy and see whether the interest rate rise is accompanied by confidence and economic growth. If the hike’s objective is to curb inflation, this may help some companies and stocks.
We must also remember the macroeconomy: prevailing oil prices, growth expectations, foreign investment, and many more aspects. Accordingly, even if the market suffers turbulence from the interest rate hike, it will hold in the long run. Why? Because of a resilient economic structure, healthy growth expectation, and a stable or improved credit rating.
These angles are subject to several factors, including the pace of raising interest rates and the recovery cycle from the pandemic for companies and businesses.
Here we see the importance of managing financial risks and anticipating these situations – without giving absolute priority to market expectations. For example, some may question a company’s decision to pay a premium to hedge against the risk of a higher SAIBOR (9 months ago or less) because no one thought inflation figures and interest rate expectations would reach current levels. This company now realizes the quality of its decision because it has prioritized risk management above other market-driven decisions, which is a form of speculation.
Pleasingly, I am witnessing many local corporates and investment funds begin to sense the risks of fluctuations in interest rates and monitor acceptable limits and their toleration for such risks. After being almost absent from the finance departments, the discussion became key.
And because each company has unique financial dynamics, we find some have no need to hedge variable interest rates despite their huge debt portfolio. This may be due to several logical reasons. One, for example, is the presence of offsetting investment assets, so there is natural hedging.
If you take only one thing from this article, it should be to analyse the economic data more closely. Sometimes we include them in our templates to justify our investment and financial decisions. The wise person takes them as indicators only to form a bigger picture and does not judge their absoluteness at all. We must also set unwavering priorities (such as risk management) and always acquire insights from different angle.
Articles


© 2025 All rights reserved to Maaal Newspaper