
Publisher: Maaal International Media Company
License: 465734


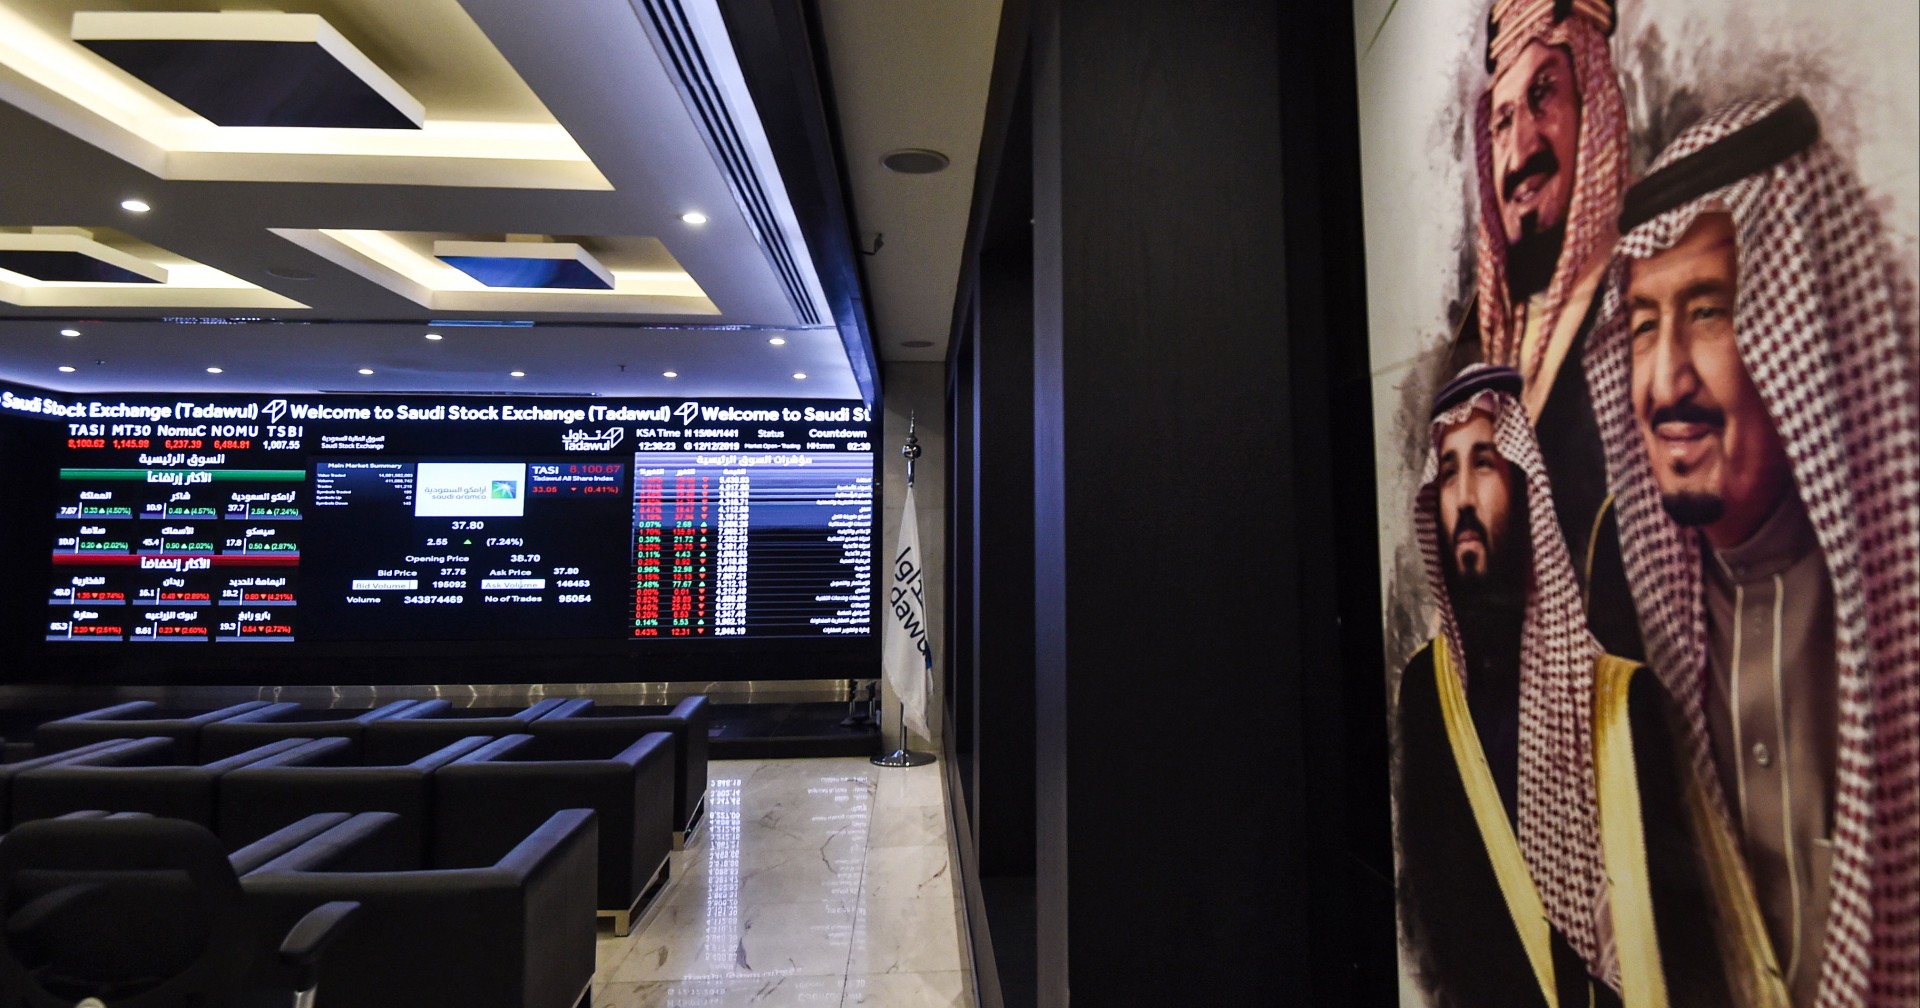
Saudi stock exchange index TASI climbed 2.3 points, during the auction, closing at 11,108.2 points, up from 11,105.93 points.
Shares of 68 companies witnessed an increase, led by CHEP 3.8%, Cables 1.3%, Shams 1%, Saudi Cement 0.9%, and Gulf Arab 0.7%, while the shares of another 58 declined, during the auction, led by BUPA ARABIA 1.5%, EIC 1.2%, and MOUWASAT. YANSAB 0.8%, JARIR 0.7%.
It’s worth noting that the closing auction is used to determine the market’s closing price, which is determined, in turn, through the auction mechanism, considering the supply and demand forces, during the closing auction period, to set the fair price.
Thus, the equilibrium price is finally reached, during the closing auction, which lasts 10 minutes.
The closing auction begins at 3:00 PM, and finishes at 3:10 PM, following the end of the continuous trading.
A closing price is derived when orders are processed, at 3:10 PM + a maximum of 30 seconds, on a daily basis.
Regular deals are used to compute the closing price, which is the deal price for shares worth more than SR15,000.
When there isn’t a regular transaction, the closing price is determined by the price of the most recent deal, during the continuous trading, on the prior day’s closing price.
Market orders are listed in the order book as the best bid/best bid during the closing auction, and with no price amid.
Tadawul trading session on the closing price is an extra, following the auction, in which only the closing price determined, can be exchanged, as the auction runs from 3:10 PM to 3:20 PM.
| Change in the stock exchange,
during the auction |
|||
| Statement | Before the auction | Close | Change |
| Market Index | 11,105.93 | 11,108.20 | 2.3 |
| Trading value, Riyal, mln | 7,097.10 | 7,481.9 | 384.8 |
|
Share, mln |
200.02 | 208.86 | 8.8 |
| Number of executed transactions | 354,098 | 363,064 | 8,966 |
| Advancing companies,
during the auction |
|||
| Company | Share price before auction (SR) | Close (SR) | Change (%) |
| CHUBB | 37.3 | 38.7 | 3.75 |
| SAUDI CABLE | 21.02 | 21.3 | 1.33 |
| TICO | 77.3 | 78.1 | 1.03 |
| Saudi Cement | 56.5 | 57 | 0.88 |
| Gulf General | 13.66 | 13.76 | 0.73 |
| BCI | 40.65 | 40.9 | 0.62 |
| FITNESS TIME | 107.4 | 108 | 0.56 |
| Catering | 83.6 | 84 | 0.48 |
| EXTRA | 131.8 | 132.4 | 0.46 |
| Advanced | 69.2 | 69.5 | 0.43 |
| ALRAJHI | 138.4 | 139 | 0.43 |
| SEEERA | 19.1 | 19.18 | 0.42 |
| MIS | 145.8 | 146.4 | 0.41 |
| ALRAJHI | 50.3 | 50.5 | 0.40 |
| Al-Omran | 102 | 102.4 | 0.39 |
| Arabian Shield | 26.15 | 26.25 | 0.38 |
| USCC | 26.65 | 26.75 | 0.38 |
| A.Othaim | 111 | 111.4 | 0.36 |
| Naseej | 29.3 | 29.4 | 0.34 |
| THEEB | 59.3 | 59.5 | 0.34 |
| SNB | 62.9 | 63.1 | 0.32 |
| ALABDULLATIF | 31.8 | 31.9 | 0.31 |
| ALBABTAIN | 32.5 | 32.6 | 0.31 |
| Savola Group | 32.95 | 33.05 | 0.30 |
| BAHRI | 33.2 | 33.3 | 0.30 |
| AYYAN | 20.84 | 20.9 | 0.29 |
| SPCC | 69.5 | 69.7 | 0.29 |
| SWICORP WABEL | 7.21 | 7.23 | 0.28 |
| ACC | 37.7 | 37.8 | 0.27 |
| EPCCO | 44.35 | 44.45 | 0.23 |
| Kingdom | 10.2 | 10.22 | 0.20 |
| Malath Insurance | 25.5 | 25.55 | 0.20 |
| ALASEEL | 51.6 | 51.7 | 0.19 |
| ARDCO | 26.5 | 26.55 | 0.19 |
| TASNEE | 21.22 | 21.26 | 0.19 |
| SSP | 26.7 | 26.75 | 0.19 |
| ALJAZIRA REIT | 22.28 | 22.32 | 0.18 |
| FIPCO | 56 | 56.1 | 0.18 |
| City Cement | 22.56 | 22.6 | 0.18 |
| ZAMIL INDUST | 30.15 | 30.2 | 0.17 |
| Etihad Etisalat | 31.05 | 31.1 | 0.16 |
| AlAHLI REIT 1 | 12.42 | 12.44 | 0.16 |
| SIIG | 31.1 | 31.15 | 0.16 |
| ASLAK | 31.15 | 31.2 | 0.16 |
| SGS | 31.95 | 32 | 0.16 |
| Taiba | 32.95 | 33 | 0.15 |
| Herfy Food | 68.3 | 68.4 | 0.15 |
| ALDREES | 68.5 | 68.6 | 0.15 |
| Nama Chemicals | 34.7 | 34.75 | 0.14 |
| Dallah Health | 74.3 | 74.4 | 0.13 |
| QACCO | 74.8 | 74.9 | 0.13 |
| Amana Insurance | 38.05 | 38.1 | 0.13 |
| SVCP | 83.9 | 84 | 0.12 |
| Sipchem | 42.1 | 42.15 | 0.12 |
| OASIS | 84.4 | 84.5 | 0.12 |
| SADAFCO | 170.4 | 170.6 | 0.12 |
| KEC | 17.28 | 17.3 | 0.12 |
| TAKWEEN | 17.98 | 18 | 0.11 |
| ALANDALUS | 18.26 | 18.28 | 0.11 |
| MEPCO | 45.7 | 45.75 | 0.11 |
| AWPT | 95.8 | 95.9 | 0.10 |
| ASEER | 19.48 | 19.5 | 0.10 |
| MULKIA | 9.8 | 9.81 | 0.10 |
| Amlak | 21.7 | 21.72 | 0.09 |
| JAZADCO | 22.04 | 22.06 | 0.09 |
| DWF | 227.4 | 227.6 | 0.09 |
| SHAKER | 23.12 | 23.14 | 0.09 |
| Alinma | 23.22 | 23.24 | 0.09 |
| Declining companies,
during the auction |
|||
| Company | Share price, before auction (SR) | Close (SR) | Change (%) |
| BUPA ARABIA | 137 | 135 | -1.46 |
| EIC | 28.5 | 28.15 | -1.23 |
| MOUWASAT | 167 | 165.6 | -0.84 |
| YANSAB | 65 | 64.5 | -0.77 |
| JARIR | 196.4 | 195 | -0.71 |
| Almarai | 48.3 | 48 | -0.62 |
| AL Maather | 8.9 | 8.85 | -0.56 |
| RIBLE | 27.3 | 27.15 | -0.55 |
| Budget Saudi | 46.25 | 46 | -0.54 |
| ALALAMIYA | 25 | 24.88 | -0.48 |
| JADWA REIT ALHARAMAIN | 8.39 | 8.35 | -0.48 |
| ALBILAD | 42.5 | 42.3 | -0.47 |
| SABIC AGRI-NUTRIENTS | 171.2 | 170.4 | -0.47 |
| ALHOKAIR | 17.48 | 17.4 | -0.46 |
| MEDGULF | 18.38 | 18.3 | -0.44 |
| Saudi Aramco | 35.2 | 35.05 | -0.43 |
| YCC | 37.2 | 37.05 | -0.40 |
| ALETIHAD | 20.3 | 20.22 | -0.39 |
| STC | 110.4 | 110 | -0.36 |
| SABIC | 112 | 111.6 | -0.36 |
| TANMIAH | 84.4 | 84.1 | -0.36 |
| Emaar | 11.32 | 11.28 | -0.35 |
| BSFR | 43.35 | 43.2 | -0.35 |
| ANB | 23.36 | 23.28 | -0.34 |
| ZAIN KSA | 12.26 | 12.22 | -0.33 |
| ALJOUF | 63.6 | 63.4 | -0.31 |
| ALKHALEEJ | 19.56 | 19.5 | -0.31 |
| Chemanol | 34.7 | 34.6 | -0.29 |
| HCC | 14.46 | 14.42 | -0.28 |
| Tawuniya | 76.4 | 76.2 | -0.26 |
| ALSAGR INSURANCE | 15.56 | 15.52 | -0.26 |
| Petrochem | 39.1 | 39 | -0.26 |
| Jadwa REIT | 15.74 | 15.7 | -0.25 |
| ALRAJHI TAKAFUL | 83.2 | 83 | -0.24 |
| MUSHARAKA REIT | 9.84 | 9.82 | -0.20 |
| RIYAD REIT | 10.2 | 10.18 | -0.20 |
| SRECO | 21.9 | 21.86 | -0.18 |
| SPPC | 23 | 22.96 | -0.17 |
| RED SEA | 23.04 | 23 | -0.17 |
| SABB | 29.95 | 29.9 | -0.17 |
| ATAA | 62.2 | 62.1 | -0.16 |
| SEDCO | 12.6 | 12.58 | -0.16 |
| Dur | 31.55 | 31.5 | -0.16 |
| NORTHERN CEMENT | 13.98 | 13.96 | -0.14 |
| Makkah | 75.2 | 75.1 | -0.13 |
| SPIMACO | 39.1 | 39.05 | -0.13 |
| Al Hammadi | 40.2 | 40.15 | -0.12 |
| ALYAMAMAH | 42.55 | 42.5 | -0.12 |
| ALKHABEER REIT | 8.7 | 8.69 | -0.11 |
| Arab Sea | 178 | 177.8 | -0.11 |
| SHARQIYAH DEV | 91.3 | 91.2 | -0.11 |
| ALARABIA | 91.7 | 91.6 | -0.11 |
| Salama | 18.5 | 18.48 | -0.11 |
| Najran Cement | 18.7 | 18.68 | -0.11 |
| SIDC | 19.04 | 19.02 | -0.11 |
| BINDAWOOD | 97.2 | 97.1 | -0.10 |
| MESC | 19.58 | 19.56 | -0.10 |
Source: Tadawul, Maaal follow up unit


Publisher: Maaal International Media Company
License: 465734
© 2025 All rights reserved to Maaal Newspaper