Publisher: Maaal International Media Company
License: 465734
Maaal survey on quarterly results
Herfy’s Record Earnings, since its IPO, in Table Breakdown
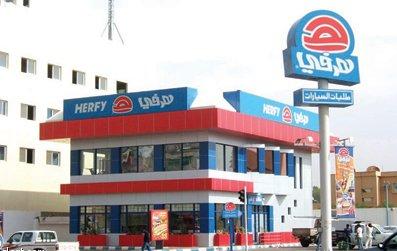
Herfy made earnings of SR60 million, at the end of Q3 of 2021, up 45.2% from SR41.4 million in the same quarter last year and 125.2% from SR26.7 million in Q2-2021.
The company’s profits in Q3-2021 were the highest quarterly profits in the company’s history, and it attributed the historical profits to a 13.2% increase in sales, as well as a decrease in general and administrative expenses, a decrease in financing expenses, and an increase in selling and marketing expenses, despite a decrease in other revenues.
The company’s quarterly profits increased by 45.2% in Q3 of this year, followed by a 33.7% increase in Q3-2014, when it recorded SR56.7 million, up from SR42.4 million in Q3-2013.
اقرأ المزيد
On the other hand, the company’s quarterly profits have been declining for 15 quarters, with the Q4-2020 seeing profits drop to SR21.3 million, down 57.1% from Q4-2019, which was SR49.6 million, and Q1-2020 seeing a 47.7% drop.
Herfy, on the other hand, experienced quarterly losses in Q2-2020, marking the company’s first loss since its initial public offering.
Because of decisions made by competent authorities as part of precautionary measures and measures to limit the spread of the new Coronavirus, including closing Herfy restaurants in commercial centers, limiting service in some restaurants to requests for home delivery, and reducing working hours in branches, the new Coronavirus has decreased by 1%.
Despite the decrease in selling and marketing expenses, financing expenses, and general and administrative expenses, as well as a decrease in other revenues, Q2-2019 included an amount of SR2.2 million as a result of the sale of some assets, despite the decrease in selling and marketing expenses, financing expenses, and general and administrative expenses, noting that the company made slow inventory provisions during Q2-2020.
The transfer was SR5 million, plus a SR5.9 million reserve for dubious debts.
A table comparing Herfy’s quarterly results with the same period since the
company’s listing
Period Quarterly results (mln Riyal) Compared to the same quarter, the
previous year (mln Riyal) Change (%)
Q1-2010 28.2 23.8 18.5
Q2-2010 32.6 31.4 3.8
Q3-2010 30.4 29.9 1.7
Q4-2010 33.09 29.6 11.8
Q1-2011 32.5 28.2 15.2
Q2-2011 39.4 32.6 20.9
Q3-2011 34.5 30.4 13.5
Q4-2011 40.3 33.09 21.8
Q1-2012 40.6 32.5 24.9
Q2-2012 49.3 39.4 25.1
Q3-2012 42.4 34.5 22.9
Q4-2012 48.9 40.3 21.3
Q1-2013 46.5 40.6 14.5
Q2-2013 51.2 49.3 3.9
Q3-2013 42.4 42.4 0.0
Q4-2013 51.3 48.9 4.9
Q1-2014 48 46.5 3.2
Q2-2014 52.4 51.2 2.3
Q3-2014 56.7 42.4 33.7
Q4-2014 48.7 51.3 -5.1
Q1-2015 54.5 48 13.5
Q2-2015 46.3 52.4 -11.6
Q3-2015 56.7 56.7 0.0
Q4-2015 45.2 48.7 -7.2
Q1-2016 53.6 54.5 -1.7
Q2-2016 49.5 46.3 6.9
Q3-2016 58.8 56.7 3.7
Q4-2016 55.4 45.2 22.6
Q1-2017 52.7 53.6 -1.7
Q2-2017 43.4 49.5 -12.3
Q3-2017 56 58.8 -4.8
Q4-2017 47.9 55.4 -13.5
Q1-2018 47.7 52.7 -9.5
Q2-2018 45.9 43.4 5.8
Q3-2018 58.1 56 3.8
Q4-2018 52.5 47.9 9.6
Q1-2019 48 47.7 0.6
Q2-2019 40.9 45.9 -10.9
Q3-2019 57.5 58.1 -1.0
Q4-2019 49.6 52.5 -5.5
Q1-2020 25.1 48 -47.7
Q2-2020 -34.2 40.9 –
Q3-2020 41.4 57.5 -28.0
Q4-2020 21.3 49.6 -57.1
Q1-2021 25.5 25.1 1.6
Q2-2021 26.7 -34.2 –
Q3-2021 60 41.4 45.2
Source: Tadawul, Maaal


